Peak Fitting
Advertisement
Fityk v.0.9.8
Fityk is user friendly, open source software for nonlinear curve fitting and data analysis.
Advertisement
MagicPlot Student v.2.3
MagicPlot is an easy to use program for scientific and engineering data analysis, graphing and nonlinear curve fitting. MagicPlot provides publication-quality graphs. It is fast, lightweight and does not need installation.
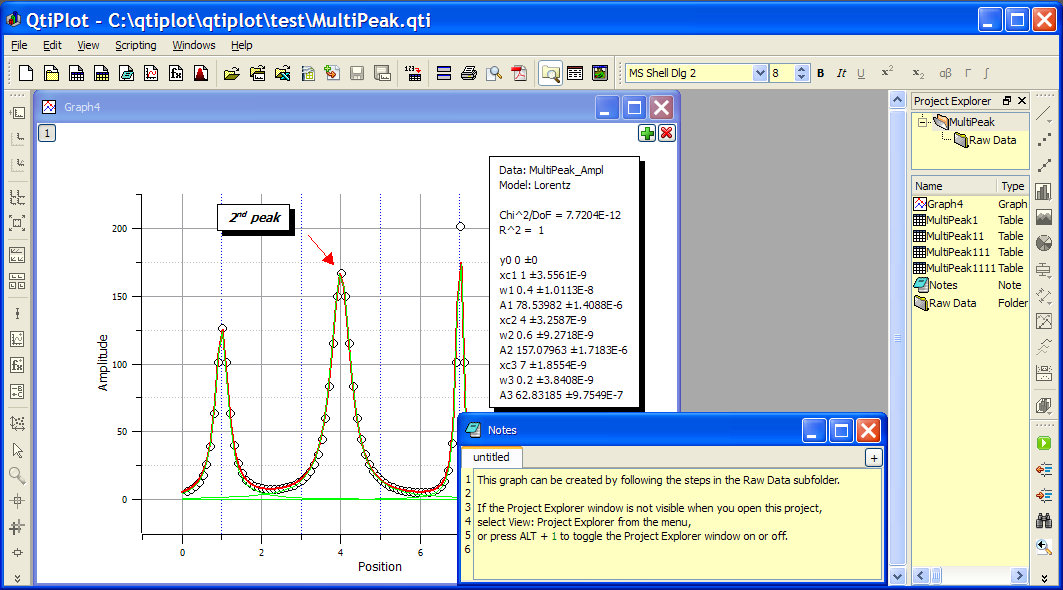
QtiPlot v.0.9.8.6
QtiPlot is a program for two- and three-dimensional graphical presentation of data sets and for data analysis. Plots can be produced from data sets stored in tables or from analytical functions.
SciDAVis v.0.2.4
SciDAVis is a free software for Scientific Data Analysis and Visualization. User-friendly software for Scientific Data Analysis and Visualisation. SciDAVis is a free interactive software aimed at data analysis and publication-quality plotting.
GSim v.0.20.1
GSim is a software for NMR spectroscopy, a free program tool for visualisation and processing of experimental and simulated nuclear magnetic resonance (NMR) spectra.
MagicPlot Calculator v.1.1
MagicPlot Calculator is a simple and easy-to-use formula calculator. MagicPlot Calculator is a free expression calculator from MagicPlot graphing application. Even if you don't use MagicPlot you can use our strong calculator.

QtiPlot for Linux v.0.9.8.9
QtiPlot is a cross platform data analysis and scientific visualisation solution.
QtiPlot for Mac OS X v.0.9.8.8
QtiPlot is a cross platform data analysis and scientific visualisation solution.
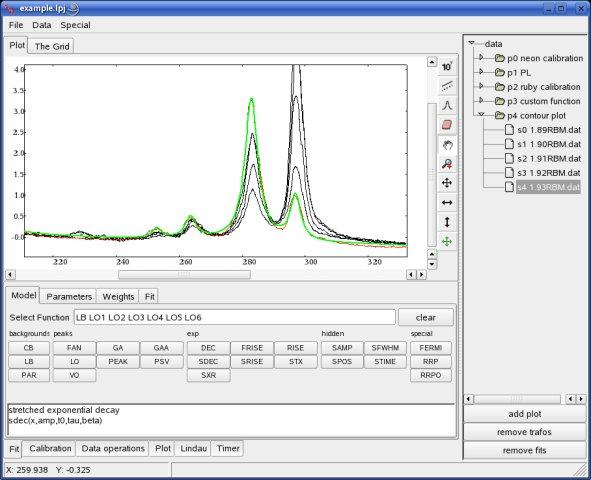
Peak-o-mat v.433
peak-o-mat is a curve fitting program aimed at the fast and easy fitting of spectroscopic data, especially if you face a large amount of similar spectra.
ADInstruments Peak Analysis v.1.2.1400
The MLS380/7 Peak Analysis Module for Windows provides automatic detection and analysis of multiple, non- overlapping, signal peaks in acquired waveforms.

Visual Fitting v.2.5.0
Math tool for linear, nonlinear curve fitting and surface fitting, curve and surface can be created.